Indian manufacturers are facing a new kind of question from customers and auditors. It is no longer enough to say how much fuel your trucks consume. Buyers now want to know the emissions linked to every shipment, every route, and every delivery.
This shift is driven by global reporting standards like the GHG Protocol and regulations such as the Carbon Border Adjustment Mechanism. As a result, Scope 3 logistics emissions in India have moved from a “nice to track” metric to a business requirement.
Let’s break this down in a practical way.
What Scope 3 Transport and Distribution Covers
Scope 3 emissions include all indirect emissions that occur in your value chain. For logistics, this means emissions from:
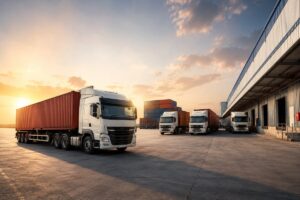
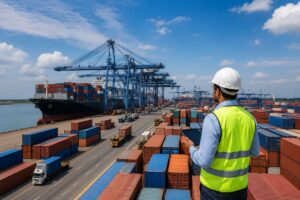
- Outbound shipments to customers
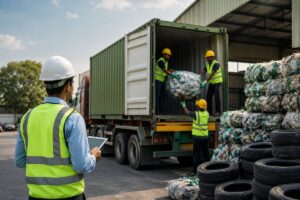
- Inbound raw material transport
- Third-party logistics providers
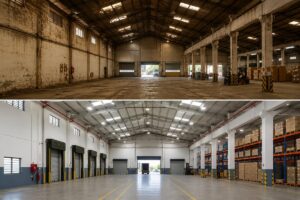
- Warehousing and distribution activities
Think of it like ordering food through an app. You may not cook the meal, but you are still responsible for the delivery experience. Similarly, even if you do not own the trucks, the emissions from those shipments still count under your Scope 3.
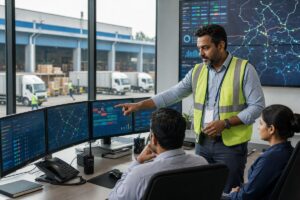
Why procurement teams now want lane-level data
Procurement teams are under pressure from global buyers. They are being asked questions like:
- What is the carbon footprint of shipping from Pune to Chennai?
- How does road transport compare to rail for the same route?
- Can emissions be reduced by changing the route or vehicle type?
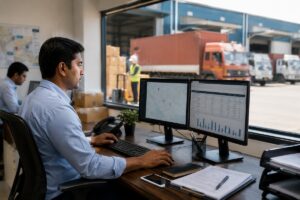
This is why lane-level emissions data is becoming essential. It allows companies to move from rough estimates to actionable insights.
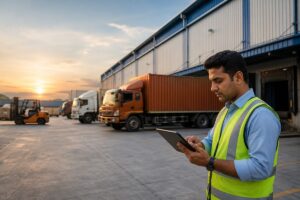
Building a Practical Data Blueprint
To report emissions accurately, you need the right data. Many companies assume this is complex, but it becomes manageable if you follow a clear structure.
1. Shipment mass or volume
Start with the basics. Record how much you are shipping.
- Weight in tonnes or kilograms
- Volume in cubic meters for lighter goods
For example, transporting 10 tonnes of steel produces a different footprint compared to transporting 2 tonnes of electronics.
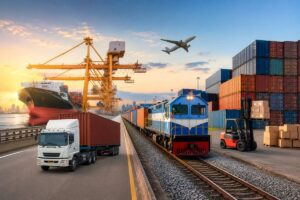
2. Distance and mode of transport
Distance directly impacts emissions. Mode matters even more.
- Road transport typically has higher emissions per tonne-km
- Rail and coastal shipping are usually more efficient
A 1,000 km shipment by truck may emit significantly more than the same shipment by rail. This is why companies are rethinking modal choices.
3. Fuel type and vehicle category
Fuel type plays a big role in emissions calculation.
- Diesel trucks
- CNG or LNG vehicles
- Electric vehicles
For example, switching from diesel to LNG can reduce emissions intensity, even if the route stays the same.
4. Empty-run assumptions
This is often overlooked but very important.
Trucks rarely run fully loaded in both directions. If a vehicle returns empty, the emissions still exist and must be allocated.
A simple approach is to assume a percentage of empty running, such as 20 to 30 percent, based on operational data.
5. Evidence hierarchy
Auditors look for proof, not just numbers.
Build your data in layers:
- Actual shipment data from transporters
- GPS or route mapping data
- Industry emission factors if primary data is unavailable
Think of it like preparing for a tax audit. The more documented your data is, the smoother the process becomes.
Aligning with Global Methods
To ensure your reporting is credible, align your calculations with recognized frameworks.
GHG Protocol Scope 3 guidance
The GHG Protocol provides a widely accepted method for calculating emissions across value chains. It helps companies:
- Categorize emissions correctly
- Use consistent emission factors
- Maintain transparency in assumptions
ISO framework for transport emissions
Many global customers now expect alignment with standards like the ISO framework for transport chain emissions.
This ensures:
- Standardized calculation methods
- Comparable results across suppliers
- Higher trust during audits
For Indian manufacturers working with multinational clients, this alignment is no longer optional.
Why CBAM Is Accelerating This Shift
The Carbon Border Adjustment Mechanism is a major driver of change.
CBAM focuses on embedded emissions in imported goods. While logistics is only one part of the total footprint, it still contributes to the overall carbon intensity of a product.
What this means in practice
If you export to the EU:
- Your customers must report total emissions
- They will request detailed data from you
- Gaps in logistics emissions data can delay compliance
Even if logistics contributes a smaller share compared to manufacturing, it can become a weak link in your reporting chain.
Think of it like a final exam. Even if you score well in most subjects, one missing paper can affect your overall result.
Moving Toward Auditor-Ready Reporting
To stay ahead, Indian manufacturers should focus on three practical steps:
- Standardize data collection across all transport partners
- Adopt a consistent calculation method aligned with global standards
- Build documentation and audit trails for every assumption
Companies that act early will not just meet compliance requirements. They will also gain an advantage in tenders, supplier evaluations, and global partnerships.
Final Thoughts
Scope 3 logistics emissions in India are no longer a future concern. They are a present requirement driven by global buyers, auditors, and regulations.
The good news is that this is not just about compliance. With the right data and approach, companies can identify inefficiencies, reduce costs, and improve sustainability at the same time.
In simple terms, better visibility leads to better decisions. And in today’s logistics landscape, that visibility starts with understanding every shipment, every route, and every emission behind it.